
Visits and trends
Virtual visits per day, week and month, and how they change around exhibitions and events.
Case study
One of Lisbon’s great monuments, published as a 360° virtual tour on Muzea in May 2024 and visited every month since, all through the Muzea web viewer. Figures from November 2026.
São Vicente de Fora has azulejo-lined cloisters, the royal pantheon of the House of Bragança and views over Alfama. But many people who are interested live far away, have little time, or can’t easily climb its stairs.
Muzea captured the monument in 360° and published the tour in the Muzea app and on the web, ready to share and to embed on the monument’s own channels.
10,245 virtual visits and 4,480 unique visitors, with visits every month since 2024 and close to 1,000 in the best month. That audience is a new source of income waiting to be opened: paid premium tours, sponsorship and data to plan exhibitions.
Simulation
Move the sliders: visits per year, how many buy a premium tour, and its price. We show what the venue keeps on Free and on Pro S.
Real data
These are the tour’s own statistics. Pro venues get the same dashboard for their tours, to plan exhibitions and show results to sponsors and boards.
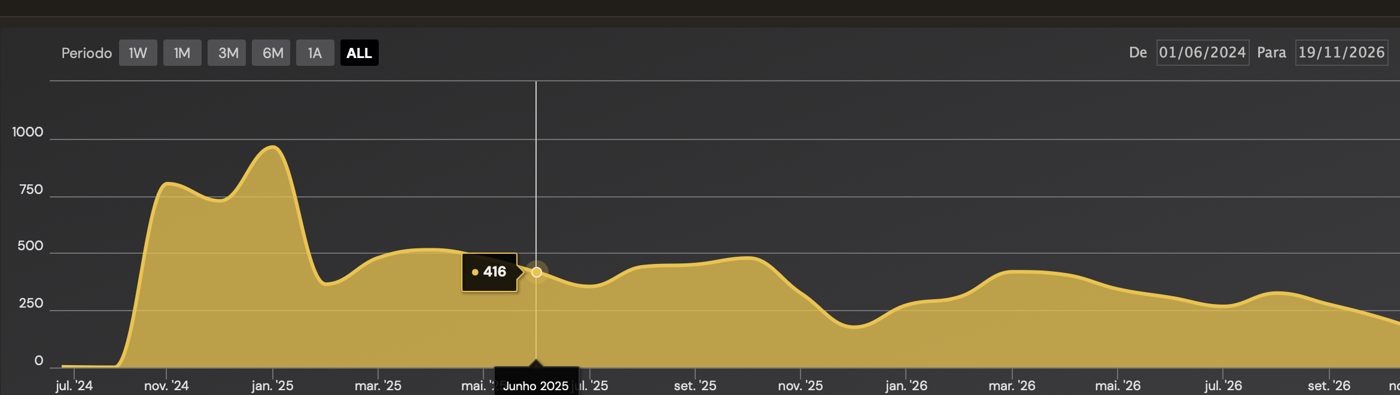
Source: the tour’s statistics dashboard, 19 November 2026. All visits counted since June 2024; unique visitors counted since May 2025. Visits come from the Muzea app, muzea.io and the monument’s website; we don’t yet separate them by channel.
Virtual visits per day, week and month, and how they change around exhibitions and events.
Countries and channels: the Muzea app, muzea.io or your own website.
How long people stay and which rooms and works they look at most.
Paid tours sold, revenue and how many visitors become buyers.
Newsletter
New virtual tours, articles and exhibitions worth seeing. No spam, unsubscribe anytime.
